We walk kindly in the footsteps of Jesus Christ as we live and learn.
Welcome
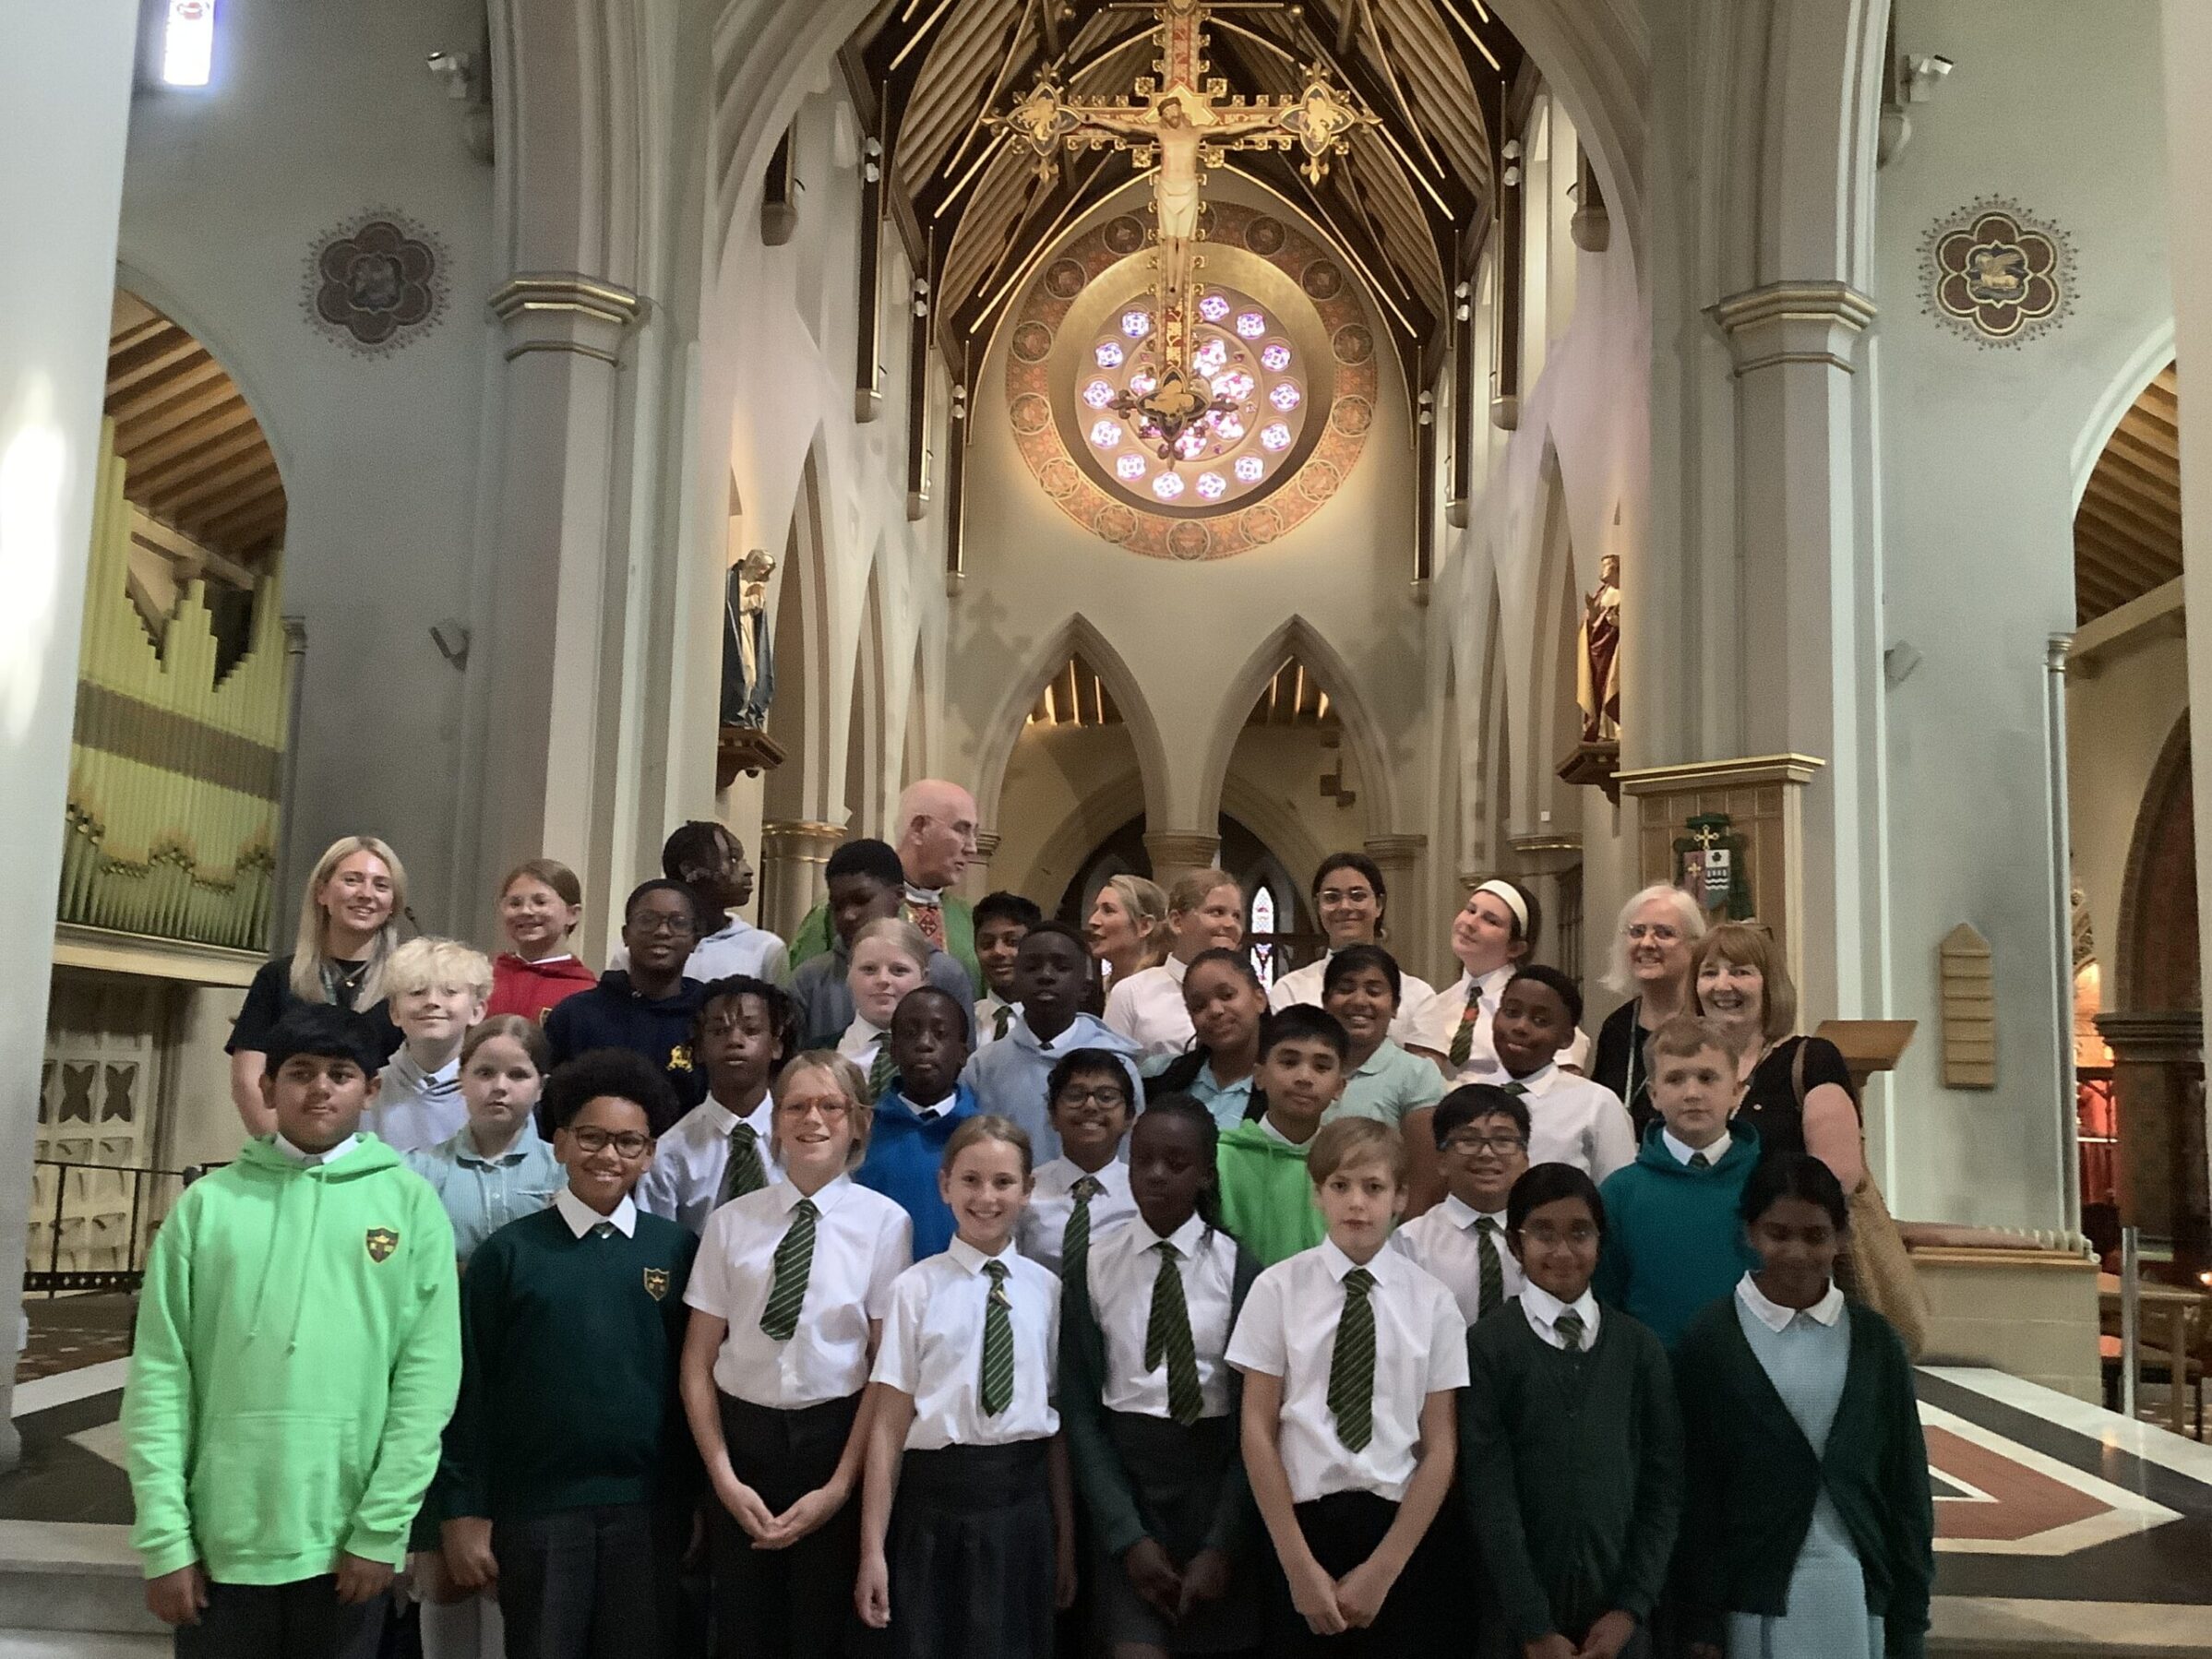
Blessed Robert Widmerpool Catholic Voluntary Academy is an outstanding school situated in Clifton and is part of the Corpus Christi parish. We are part of the Our Lady of Lourdes Multi-Academy Trust and Catholic values underpin every aspect of school life through stimulating and creative liturgical worship.
The school aims to create a happy and secure environment where our children can reach their potential – spiritually, morally, culturally, physically and academically. We encourage our children to be responsible for their own actions, and a culture of independence and respect is promoted through our core values.
The curriculum of the school, underpinned and inspired by the teachings of the Catholic Church, recognises that each child is a unique and valued individual. The curriculum promotes respect for the views of each child, as well as for people of all cultures. All our children are respected and treated with fairness and honesty – enabling all the school community to reach their full potential.


Discover Blessed Robert Widmerpool